Model & Experiment Tracking with MLflow
Why use MLflow
AI Platfom allows teams to run their notebooks and pipelines using an MLflow plug-in.
MLflow is an open source platform for managing the end-to-end machine learning lifecycle. It tackles four primary functions:
- Tracking experiments to record and compare parameters and results (MLflow Tracking).
- Packaging ML code in a reusable, reproducible form in order to share with other data scientists or transfer to production (MLflow Projects).
- Managing and deploying models from a variety of ML libraries to a variety of model serving and inference platforms (MLflow Models).
- Providing a central model store to collaboratively manage the full lifecycle of an MLflow Model, including model versioning, stage transitions, and annotations (MLflow Model Registry). MLflow is library-agnostic. You can use it with any machine learning library, and in any programming language, since all functions are accessible through a REST API and CLI. For convenience, the project also includes a Python API, R API, and Java API.
In the following sections, you can find instructions for using MLflow in AI Platform.
MLflow server setup
To automatically set up your own MLfLow server, follow these steps:
-
Create a storage account in the Azure Portal. After creating the account, collect the following values:
- Azure Storage Account
- Container Name
- Azure Storage key
If the storage account is new, generate the key in the Azure Portal by going to Storage account > Security + networking > Access keys. Copy key and storage account name for use in the following steps.
-
Go to the AI Platform dashboard.
-
In the side menu, go to Applications and then do the following:
-
Select Create MLflow to open the settings dialog box.
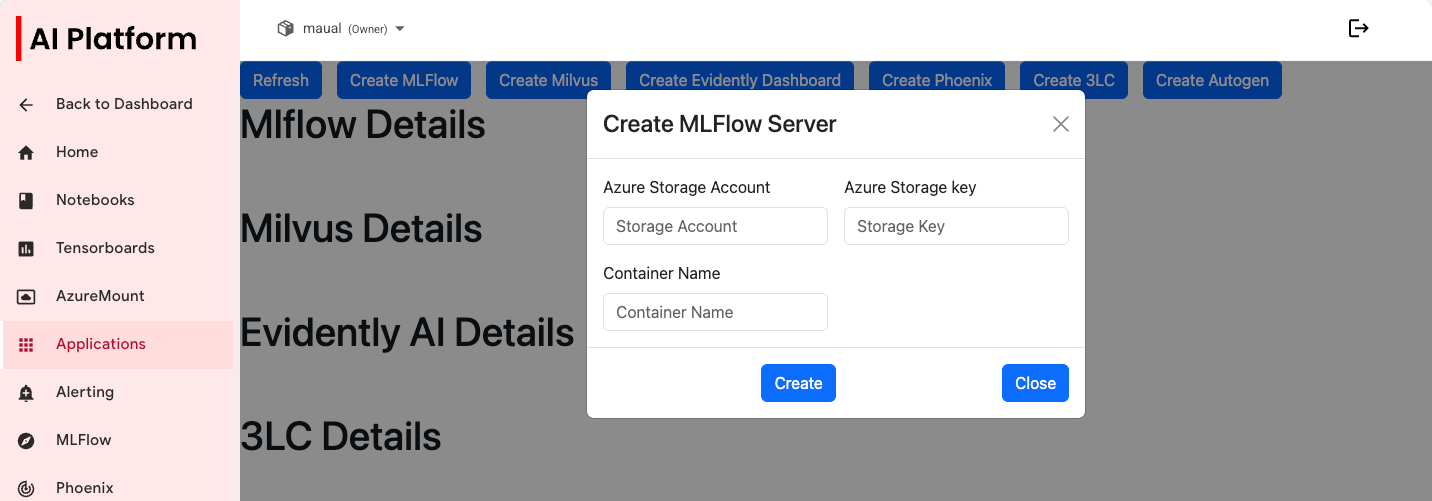 Create MLflow server settings dialog box.
 -
Enter the corresponding values.
-
Click Create. This will spin up the relevant resources in the background for you.
-
Click Refresh.
infoYou will get information relevant to your MLflow server. This includes the internal URL which will be used when you track experiments, as well as the external URL, which directs you to the UI. This UI can also now be seen in the MLflow tab on the left-hand side menu.
-
View MLflow tracking UI in browser
In your browser, replace the placeholders and go to the following URL:
https://{Cluster_Domain}/mlflow-tracking-front-{project_name}/
For example: https://kubeflow16.internal.aurora.equinor.com/mlflow-tracking-front/
You should see MLflow Tracking UI in the browser:
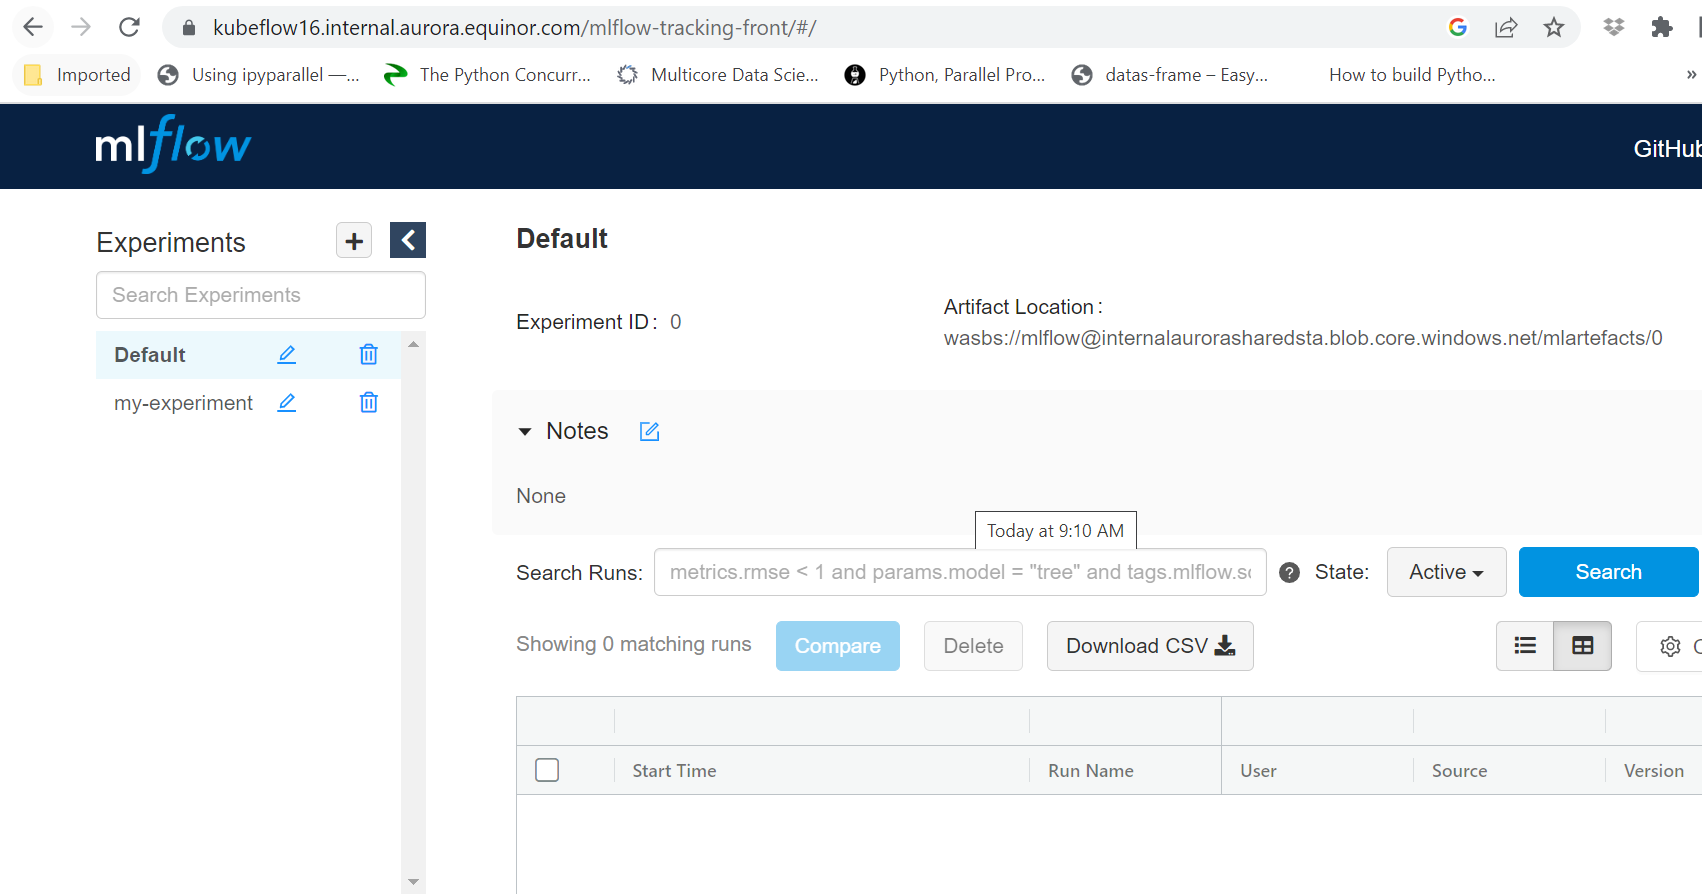 MLflow tracking UI
Track ML experiments using MLflow
- In your
MLflowExperimentDemo.ipynbnotebook, set the following:- Tracking URI: use the IP address and port values displayed in the Applications > MLflow section of the AI Platform dashboard.
- Create/Set an Experiment: change name
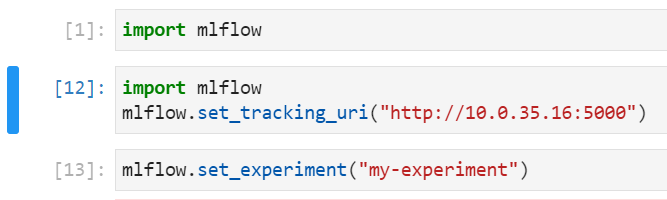 Tracking URI and experiment in notebook
-
Run your
MLflowExperimentDemo.ipynbnotebook.After running the experiment, you can see the results of your experiment on MLflow UI.
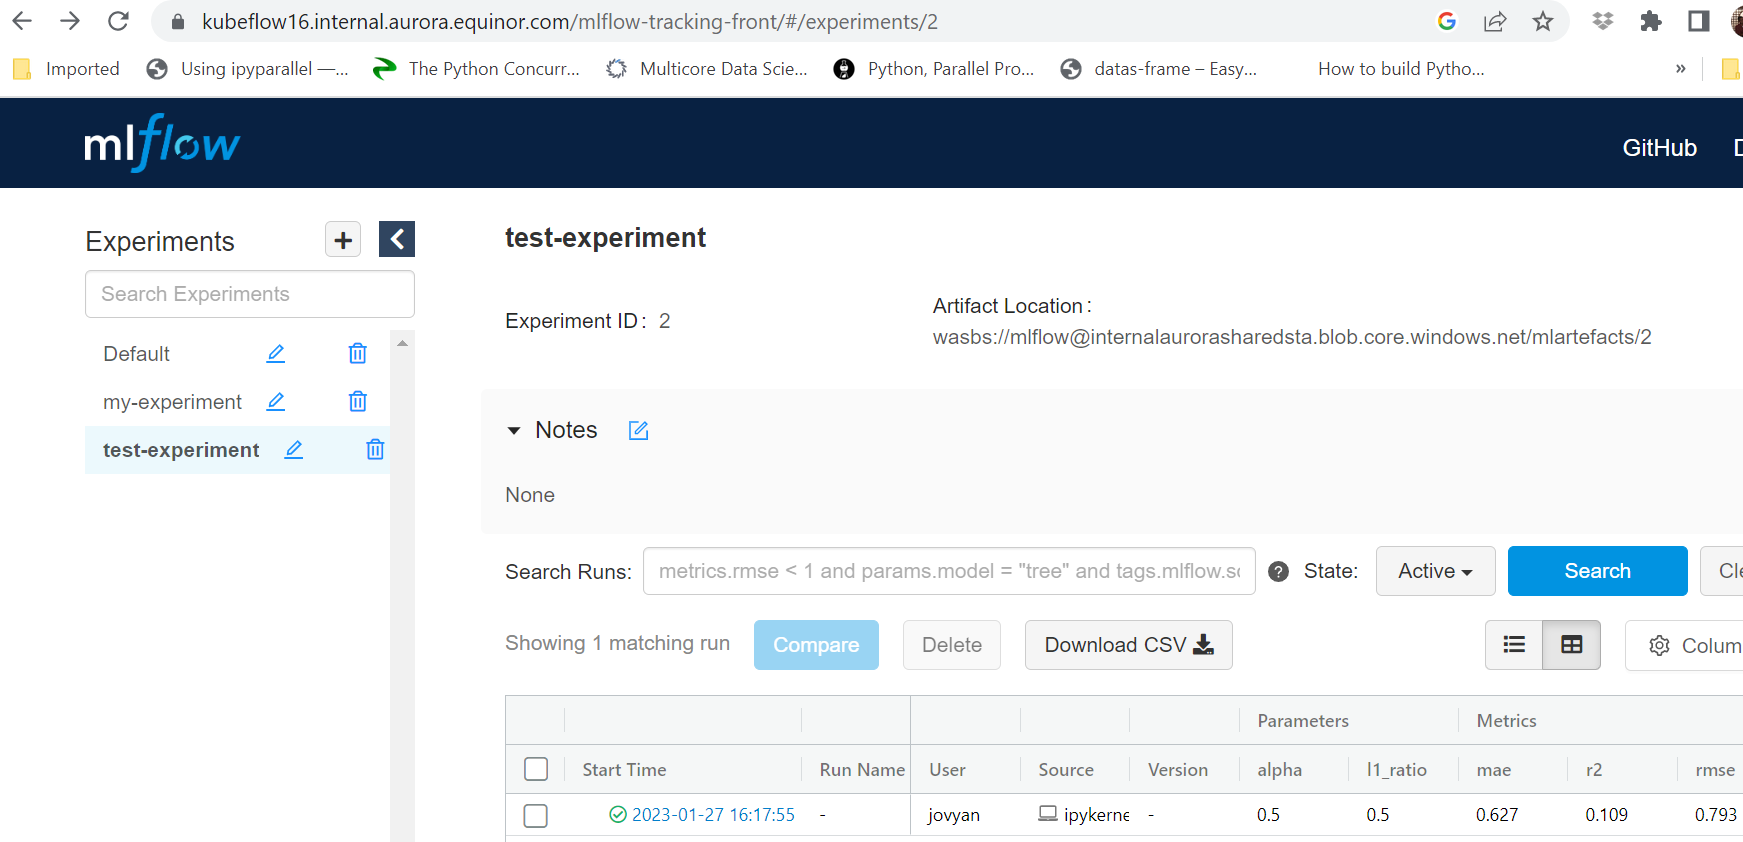 Experiments in MLflowBest practice
Running the experiment directly from the notebook will not track the GitHub repository commit version to the experiment. This is not a recommended approach for proper experimentation tracking. Rather, you may use this method if you are testing temporarily from notebooks without lineage to a GitHub code version.
Go through the following steps if you want to properly track experiments while logging GitHub branch commit versions on the runs.
-
Commit all your latest changes to the GitHub repository to ensure that the GitHub code version matches with experiments and runs are being tracked.
-
From the terminal, use the following command (defined in the
MLprojectfile):python MLflowExperimentDemo.py
Log artifacts/logs (files/directory) using MLflow
-
In
MLflowArtifactTrackingDemo.ipynbandMLflowLogTrackingDemo.ipynb, set the following:- Tracking URI: use the IP address and port values obtained previously
- Create/Set an Experiment: change name
-
Run your
MLflowArtifactTrackingDemo.ipynbandMLflowLogTrackingDemo.ipynbnotebooks. After running the notebooks, you can view the artifacts on MLflow UI. -
To log GitHub commit code versions properly, you need to generate a Python script from the notebook and specify to run that as an entrypoint in the
MLprojectfile. Then, you may run the script using that command from the terminal.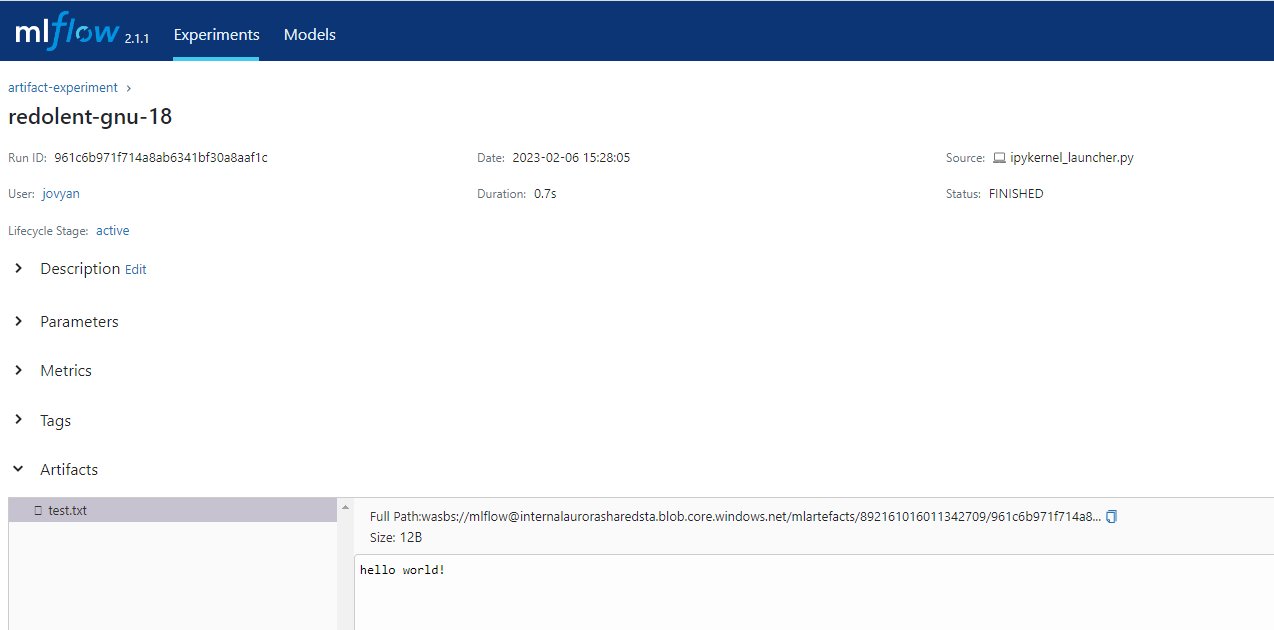 Artifacts in MLflow experiments
Log and register Scikit-learn ML model using MLflow
-
In
MLflowModelRegistrationDemo.ipynb, set the following:- Tracking URI: use the IP address and port values obtained previously
- Create/Set an Experiment: change name
-
Run the
MLflowModelRegistrationDemo.ipynbnotebook. After running the notebook, you can view the scikit-learn model saved and registered on MLflow UI. -
To log GitHub commit code versions properly, you need to generate a Python script from the notebook and specify to run that as an entrypoint in the
MLprojectfile. Then, you may run the script using that command from the terminal.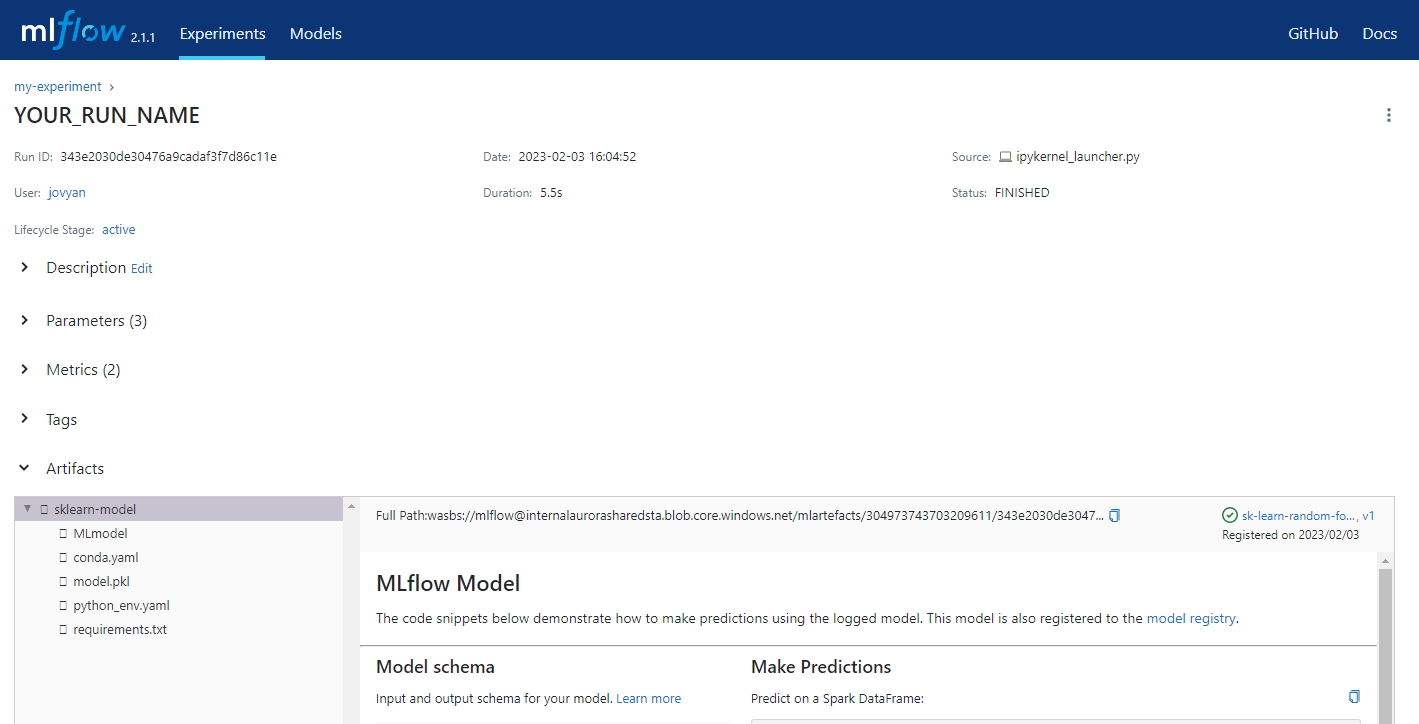 Artifacts in MLflow experiments
Adding labels and tags to your experiments and models
For an example that covers experiment tracking, model registration, and tagging, run the following notebook:
Tracking computer vision experiments
Logging model training parameters, metrics, and artifacts in Kubeflow using MLflow, as demonstrated in Computer Vision examples.
The following script establishes a callback class for recording metrics during evaluation. It specifies the MLflow server URL, the experiment name, and securely manages logging credentials via the 'AZURE_STORAGE_ACCESS_KEY' environment variable.
import mlflow  # Import the mlflow library for logging
import os  # Import the os library for interacting with the operating system
from config_blobstorage import access_key  # Import the access key from the config_blobstorage module
from transformers import TrainerCallback, TrainerState, TrainerControl  # Import necessary classes from the transformers library

class MLflowCallback(TrainerCallback):
    """
    A custom callback that logs metrics to MLflow, handling lists of metrics.
    """
    def on_evaluate(self, args, state: TrainerState, control: TrainerControl, **kwargs):
        # Log metrics to MLflow
        metrics = kwargs.get('metrics', {})
        for key, value in metrics.items():
            if isinstance(value, list):  # Check if the metric is a list
                for idx, val in enumerate(value):
                    if val is not None:  # Ensure the value is not NaN
                        metric_name = f"{key}_{idx}"
                        mlflow.log_metric(metric_name, val, step=state.global_step)
            elif value is not None:  # Log non-list metrics that are not NaN
                mlflow.log_metric(key, value, step=state.global_step)

mlflow.set_tracking_uri("http://aurora-mlflow.<your_namespace>.svc.cluster.local:5000")  # Set the tracking URI for the MLflow server
mlflow.set_experiment("hj_gsv2-training")  # Set the experiment name in MLflow
os.environ["AZURE_STORAGE_ACCESS_KEY"] = access_key  # Set the Azure storage access key in the environment variable
An example of how this can be configured for the Trainer object from the Transformers library is provided below:
trainer = Trainer(
    model=model,
    args=training_args,
    train_dataset=train_ds,
    eval_dataset=test_ds,
    compute_metrics=compute_metrics,
    callbacks=[MLflowCallback]  # Add the custom callback
)
To initiate model training and logging data to MLflow, the following process can be employed to record parameters (including model settings and constants used during training), metrics (such as training and validation performance throughout model training), and model artifacts (including generated images, predictions, graphs, model weights, etc.).
with mlflow.start_run():
    # Log parameters
    mlflow.log_params(training_args.to_dict())
    # Train the model
    trainer.train()
    trainer.save_model(model_save_dir)
    # Iterate over the items in model_save_dir
    for item in os.listdir(model_save_dir):
        item_path = os.path.join(model_save_dir, item)
        # Check if the item is a file and log it
        if os.path.isfile(item_path):
            mlflow.log_artifact(item_path)
The MLflow application interface displays a list of experiments in a vertical menu, with the runs for each experiment listed beneath. Each run contains all logged parameters, metrics, and artifacts recorded during model training.
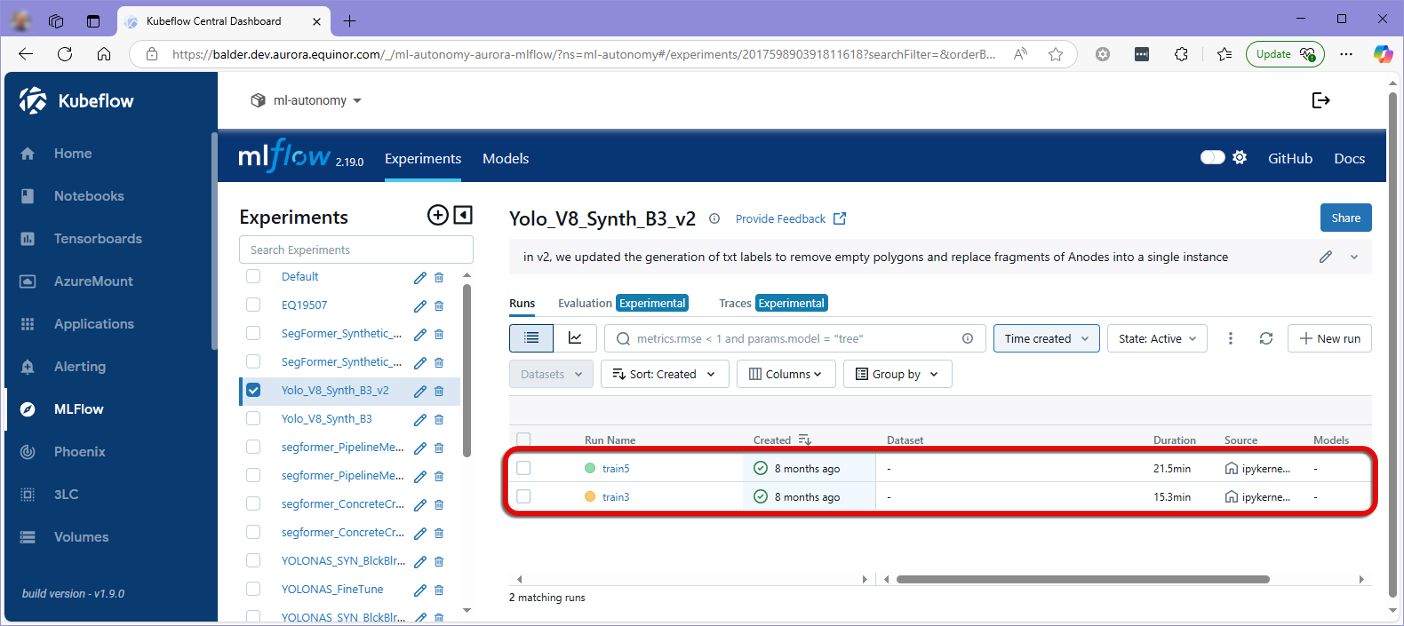 Figure 1: List of experiments
Additionally, MLflow provides the ability to compare multiple runs concurrently, allowing users to analyze differences, monitor improvements, and quantify variations in the final metrics observed across the runs.
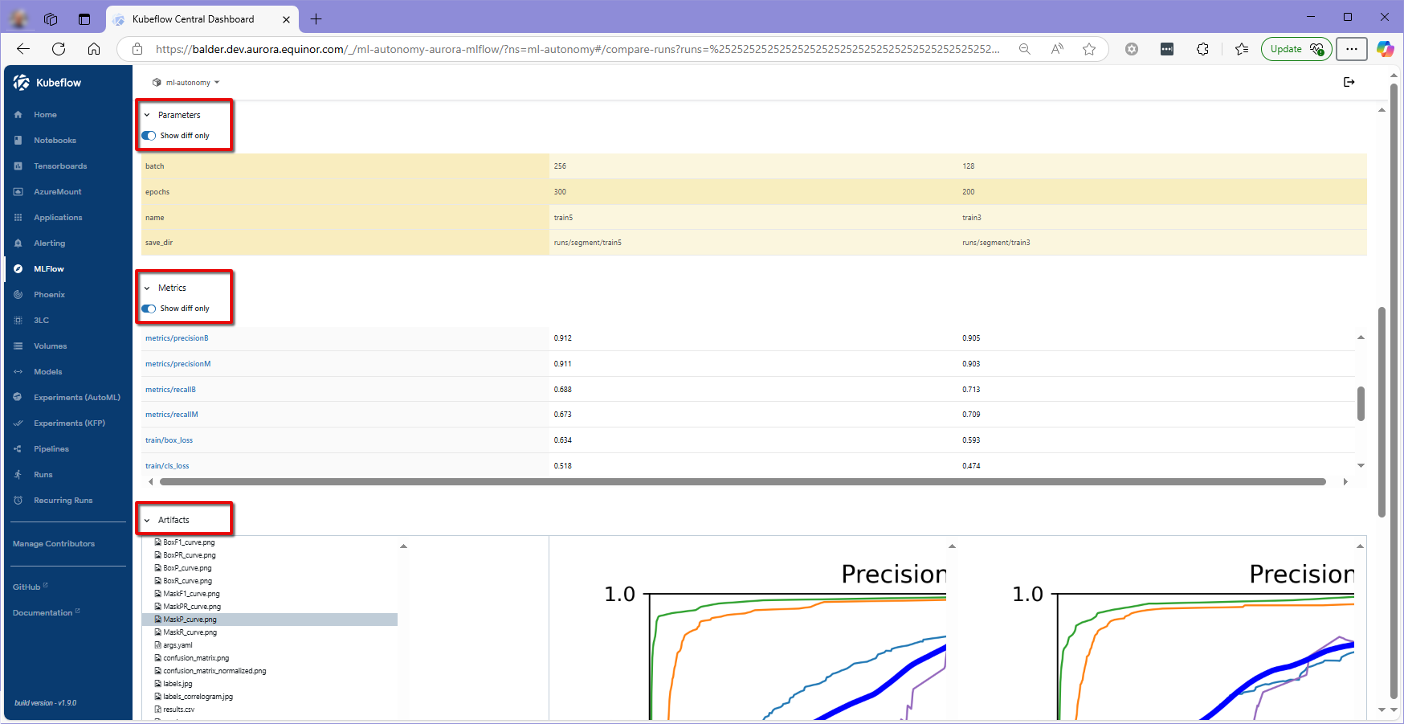 Figure 2: Run comparisons